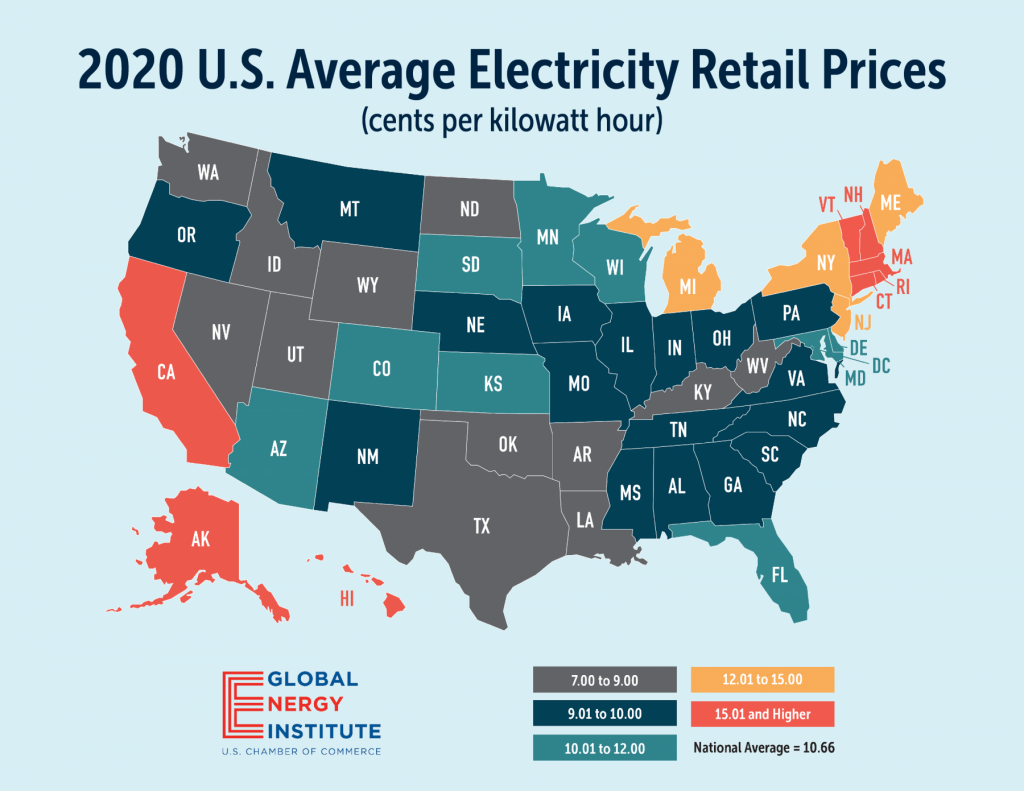
This is the latest version of the annual U.S. electricity price map. Using the most recent full year of data available from the U.S. Energy Information Administration, this map gives insight into what electricity costs across the country. As always, the map shows that there are stark differences from state to state. While the energy mix available within a state will play a large role in state electricity prices, energy-limiting policies in some states act to artificially elevate prices, making the price of electricity much higher for consumers and businesses. See where your state ranks, and compare it to the national average below. The number is the rate in US cents per kilowatt hour.

| Alabama | 9.91 |
| Alaska | 20.20 |
| Arizona | 10.59 |
| Arkansas | 8.25 |
| California | 18.15 |
| Colorado | 10.25 |
| Connecticut | 19.19 |
| Delaware | 10.46 |
| Dist. Of Columbia | 11.97 |
| Florida | 10.35 |
| Georgia | 9.75 |
| Hawaii | 27.67 |
| Idaho | 8.01 |
| Illinois | 9.56 |
| Indiana | 9.75 |
| Iowa | 9.28 |
| Kansas | 10.32 |
| Kentucky | 8.56 |
| Louisiana | 7.50 |
| Maine | 13.59 |
| Maryland | 11.16 |
| Massachusetts | 18.05 |
| Michigan | 12.37 |
| Minnesota | 10.84 |
| Mississippi | 9.18 |
| Missouri | 9.41 |
| Montana | 9.27 |
| Nebraska | 9.14 |
| Nevada | 8.38 |
| New | 9.43 |
| New | 13.71 |
| New | 14.90 |
| New Hampshire | 16.58 |
| North | 9.50 |
| North Dakota | 8.77 |
| Ohio | 9.28 |
| Oklahoma | 7.46 |
| Oregon | 9.15 |
| Pennsylvania | 9.69 |
| Rhode Island | 18.55 |
| South | 10.07 |
| South Carolina | 9.73 |
| Tennessee | 9.62 |
| Texas | 8.58 |
| Utah | 8.37 |
| Vermont | 16.28 |
| Virginia | 9.29 |
| Washington | 8.33 |
| West Virginia | 8.75 |
| Wisconsin | 11.22 |
| Wyoming | 8.29 |
| National Average | 10.66 |
Information and image courtesy of the Global Energy Institute division of the US Chamber of Commerce. https://www.globalenergyinstitute.org/average-electricity-retail-prices-map